
Medical Supply Chain Analytics with Trovares (RocketGraph)
Network Graphing + Market Strategy Project Python, Jupyter Notebook, Trovares Desktop (RocketGraph)
One Liner
Explored real-world graph analytics and market strategy using Trovares (now RocketGraph) to visualize complex medical supply chains and provide product feedback.


About The Project
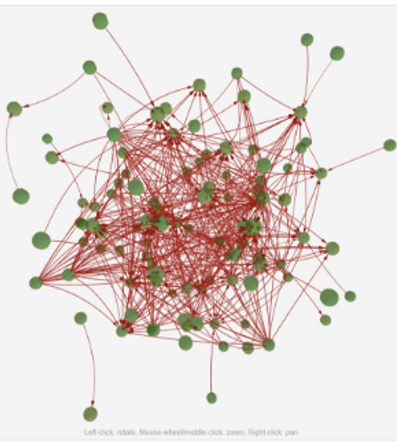
This project was a collaboration with Trovares, an advanced AI-driven graph analytics company now known as RocketGraph. Our objective was to test the functionality of the Trovares Desktop platform while conducting exploratory data analysis on large supply chain datasets. After initially focusing on job market data, our team pivoted to a dataset involving global shipments of medical products. Using graph schema modeling, we mapped relationships between vendors, products, shipment modes, and destination countries to uncover logistical trends, supply bottlenecks, and cost inefficiencies.

MY ROLE
-
Hands-on exploration and testing of Trovares Desktop with real datasets
-
Built and refined graph schemas to model supply chain networks
-
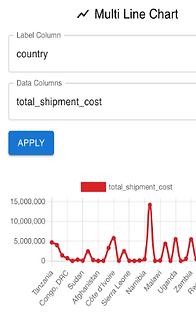
Conducted analysis in Python to validate results and enhance insight
-
Provided product feedback to the Trovares team to improve usability and performance
-
Co-created the final presentation detailing findings and recommendations

CHALLENGES
How We Solve Them?
Making music sharing feel truly social:
Technical friction with the platform
Early bugs and data formatting issues (e.g., delimiter handling) forced us to switch datasets. We overcame this by consulting directly with the Trovares team and retooling our approach through experimentation and Python validation.
Complex schema modeling
Creating meaningful schemas that reflected supply chain relationships was non-trivial. Through trial and error, we built multiple iterations that visualized key flows between vendors, products, and destinations.
Visualization bottlenecks
The platform struggled with rendering large graphs or producing clear visual insights. We addressed this by supplementing our work with Python plots and by proposing UX improvements directly to the company.
OUTCOMES & IMPACT
-
Identified usability issues and proposed targeted improvements, including better error messaging and AI-assisted schema generation
-
Created complex graph schemas modeling vendor-product-country relationships for medical shipments
-
Highlighted cost optimization opportunities (e.g., prioritizing ocean freight for bulky low-value goods)
-
Demonstrated the platform’s potential for expanding into B2B healthcare logistics analytics
-
Presented findings and recommendations directly to the Trovares team as part of a formal product feedback cycle